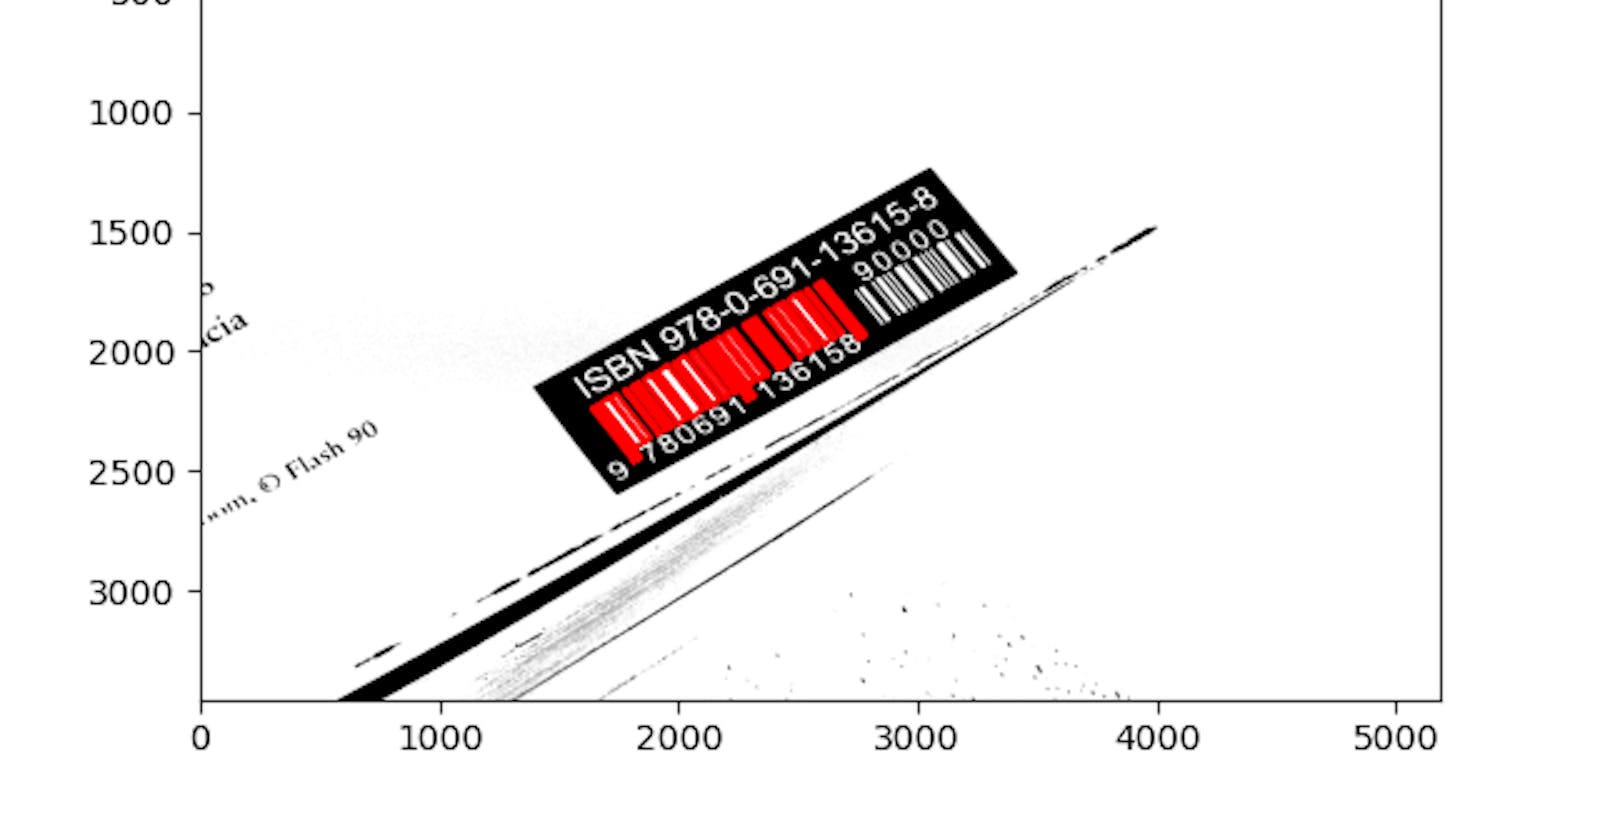
I've made several attempts over the years to have me a "library program" with a database of books I own. This way I could easily loan them and fear less for tracking their fate. I'll be able to search on author, title, etc. But I've made several attempts on the idea that all failed. The coding was actually easy-peasy, whether I did it in Visual Basic 6.0 (it was the year 2000), in Perl, or whatever. What's so hard about a database access program? Filling it out, that's what.
It turns out, if you have hundreds of books, you'll never fill out the database, and the program you wrote for it would be useless. So I thought, next time I'll get a barcode reader and hook it up to my program. But I've been an algorithm developer for a while now, so why waste money on hardware when I can do it myself, and have some fun while doing so?
So I started hacking together something in Python, a simple program that does classic image processing to find the bars and convert them to a number. No machine learning, nothing fancy. So here's what I did.
Getting started
First off, I took some pictures. You can see them all in the Github repository. Here's one example:
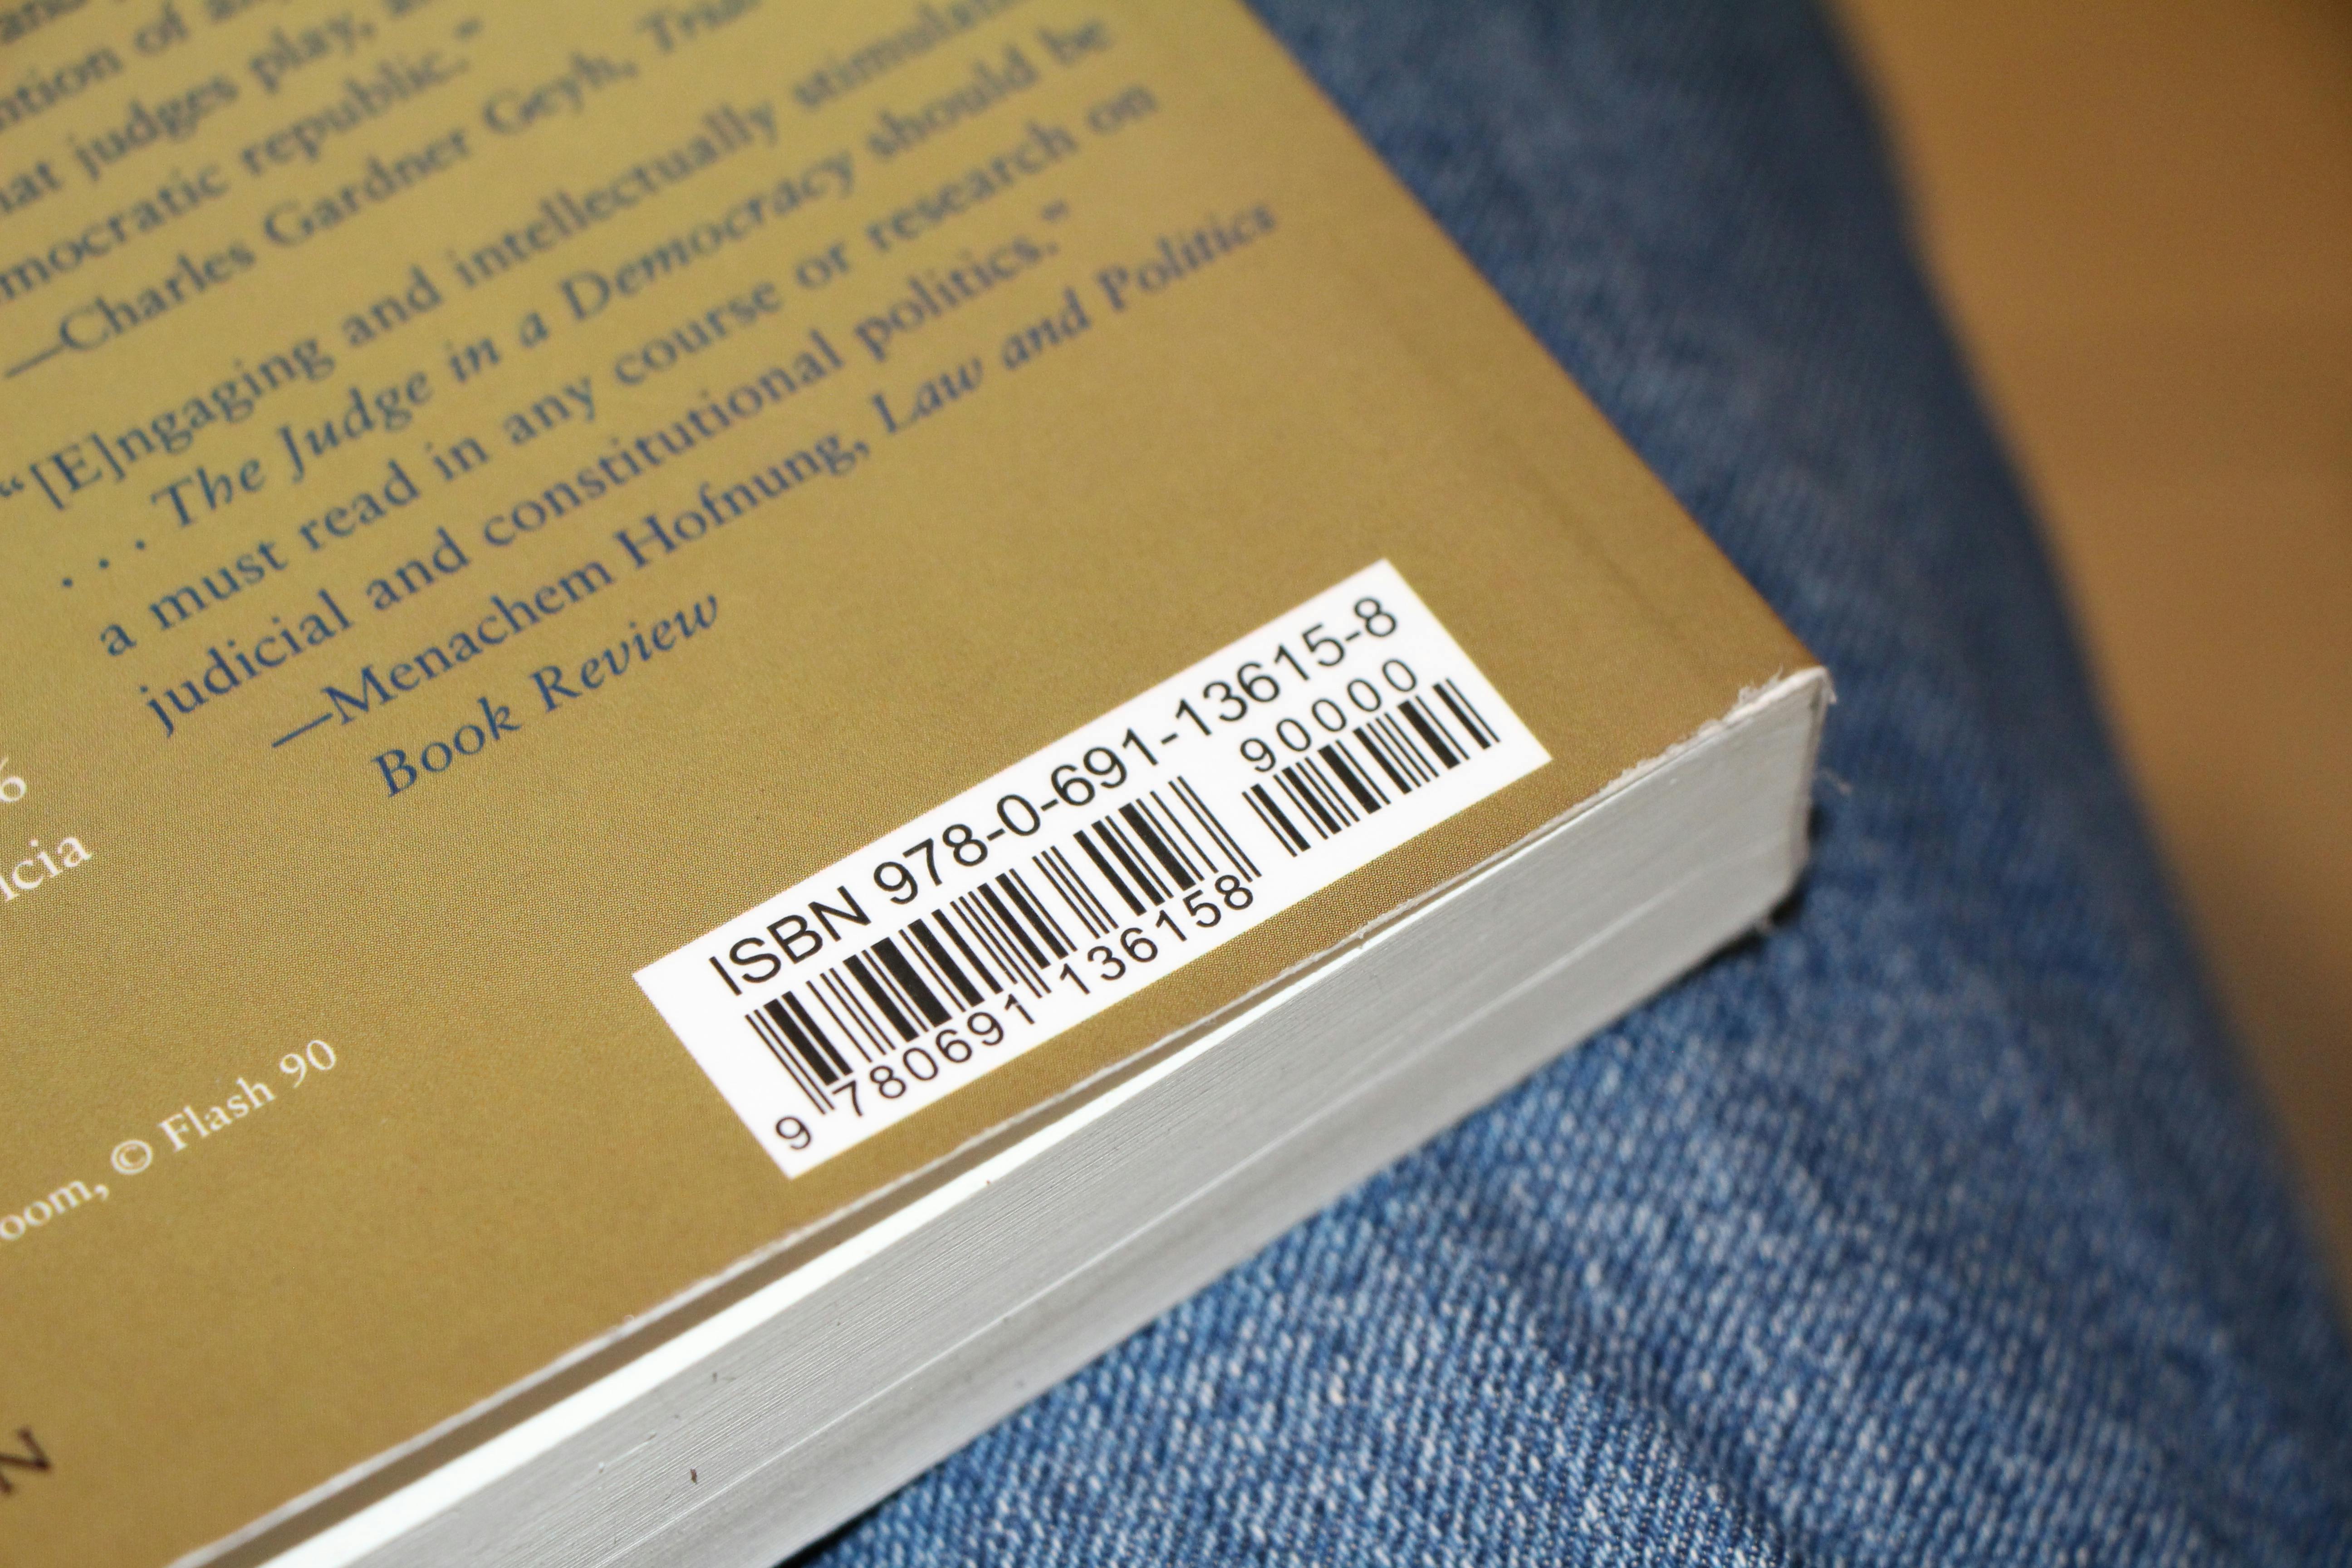
As evident here, I wanted to be tolerant to some rotation. Another thing that is evident here is that there is more than one barcode format. Here we have the EAN-13 format with 30 varying-width bars on the left, and a shorter, 16-bar EAN-5 barcode. The longer form is what I want - it describes the book itself. The shorter is an optional code for price and currency. Many books come just with the 30-bar code. Decoding the bars follows certain rules, but we'll get to that. First, we want to extract the bars themselves.
To open an image and manipulate it, I used OpenCV - a venerable computer vision package.
import cv2 as cv
im = cv.imread(im_name)   # here im_name comes from a list, see the source.

# You can show it to make sure it's loaded right.
# OpenCV has its own image view options, but I like Matplotlib.
import matplotlib.pyplot as pl
pl.imshow(im[...,::-1]) # OpenCV is BGR, Matplotlib assumes RGB
pl.show()
From color image to bars
The color image shows you that you got the right data, but to get the bars, you don't need color. You don't even need greyscale. You just need a binary image - completely black or completely white pixels. This is done with openCV by converting to greyscale and applying a threshold for dividing all greys below it to black, and all above it to white.
def image_edges(im):
    """
    Convert the image to grey scale, clean, and prepare it for contour-finding.
    Current method is just to threshold.
    """
    grey = cv.cvtColor(im, cv.COLOR_BGR2GRAY)
    work_sample = cv.threshold(grey, 200, 255, cv.THRESH_BINARY_INV)[1]

    return work_sample
Note the threshold value of 200. It was selected by trial and error on a set of 3 test images, which is a pretty small set for this kind of work. A wrong value can, on some images, cause the bars to merge with the letters below. That's a pitfall I chose to ignore for now. To make it more waterproof, image morphology can probably help in pre-separating features.
Anyway, now that we have a binary image, we want to get the bars by finding contours in the image, where the change from black to white defines a shape. We then want to describe each shape as a box with a certain width, height, and inclination. This is also easily done with OpenCV, but there are caveats. Can you see it?
def find_long_contours(edges_image):
    """
    Turn a binary image to a list of rectangles
    fitted to the contour. Only long rectangles (aspect >= given aspect)
    are taken, and angles are edited to make height always the larger quantity.
    """
    contours, _ = cv.findContours(edges_image, cv.RETR_TREE, cv.CHAIN_APPROX_SIMPLE)

    filtered_rects = []
    for cnt in contours:
        # Fit a box to it. Determine if part of barcode.
        rect = cv.minAreaRect(cnt)
        width = rect[1][0]
        height = rect[1][1]

        # Ensure that height is always the larger quantity.
        if width > height:
            width, height = height, width
            angle = rect[2] + 90 # angle. It's the same rect after the width-height change.
            rect = (rect[0], (width, height), angle)

        if width <= 0 or height/width < 4.5:
            continue

        filtered_rects.append(rect)

    return filtered_rects
For one, the contours will come in all shapes and sizes, and denote parts of letters, the book's edge, and other features we are not interested in. Here we try to make a preliminary filter by taking only those with a large aspect ratio. We also ensure that the inclination is always within a certain range. A box can be equally described by another box rotated by 90 degrees with its width and height switched. However, that is not enough. If we display the image with the contours we got, we can see still lots of garbage:
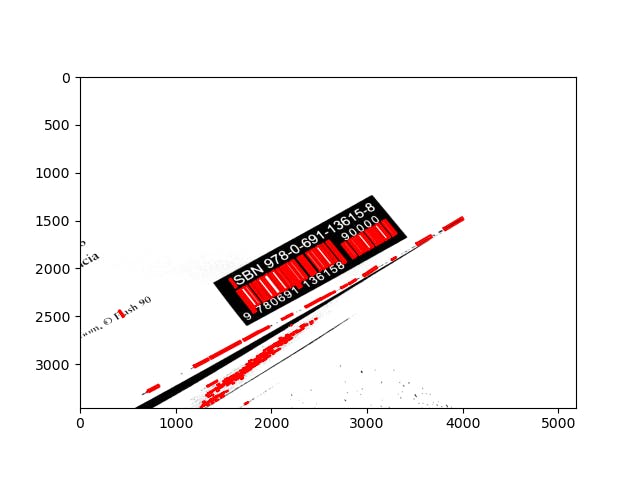
We are still left with garbage with high aspect ratio, and we even identified bar-like letters like the 'I' in "ISBN". For Hebrew books the problem is even worse, since many letters have bars or bar-like parts.
To filter all this out, I decided to use a clustering procedure. A cluster is a set of points that are close together in some sense. I reasoned so: if I draw for each box a point on the height/angle plain, I'll have to find a 30-point cluster, because there are 30 bars in a barcode. In this case, since we are looking for a cluster that's supposed to be well-separated from its surrounding, and we can have many points that don't belong in a cluster, a good algorithm choice is DBSCAN.
Fortunately, I don't have to write it from scratch, because of another well-known package. scikit-learn (or sklearn for short) is a machine-learning package containing many goodies. although DBSCAN doesn't really contain much learning, clustering is one of the main ML application areas, so sklearn provides a lot of clustering facilities. Now we have only the right bars:
from sklearn.cluster import DBSCAN

def find_long_contours_cluster(long_boxes):
    """
    Finds among the long contours a cluster that's supposed to represent the barcode.

    Arguments:
    long_boxes - a list of boxes (as represented by OpenCV box fitting).

    Returns:
    a list of boxes that belong to a 30-boxes tight cluster in height/angle plane.
    """
    cluster_boxes = []
    heights = np.array([r[1][1] for r in long_boxes])
    angles = np.array([r[2] for r in long_boxes])

    # Rescale to [0,1] for use with DBSCAN:
    heights_scaled = (heights - heights.min())/(heights.max() - heights.min())
    angles_scaled = angles/360

    clustering = DBSCAN(eps=0.15, min_samples=3).fit(np.c_[heights_scaled, angles_scaled])

    # 30 bars in a barcode [1]
    cluster_ids = np.unique(clustering.labels_)
    #pl.figure()
    #pl.scatter(heights, angles, c=clustering.labels_)
    #pl.show()

    # Choose the cluster with the right number of points:
    counts = [(clustering.labels_ == l).sum() for l in cluster_ids]
    bars_label = np.nonzero((np.r_[counts] == 30) | (np.r_[counts] == 46))[0][0]

    # Because one label can be '-1' for unclustered points:
    uncluster_adj = 0
    if cluster_ids[0] == -1:
        bars_label -= 1
        uncluster_adj = 1

    for rid, rect in enumerate(long_boxes):
        if clustering.labels_[rid] == bars_label:
            cluster_boxes.append(rect)

    # If the cluster is 46-long, it means a UPC-E barcode (6 digits, 16 bars)
    # is attached to the UPC-A barcode. Get rid of it for now:
    if counts[bars_label + uncluster_adj] == 46:
        cluster_boxes.sort(key=lambda b: b[0][0]) # For now assume they're kind-of vertical.

    return cluster_boxes[:30] # just throw out the addendum
If you enable the commented-out code, you may get a scatter plot on the height-angle that looks like this:
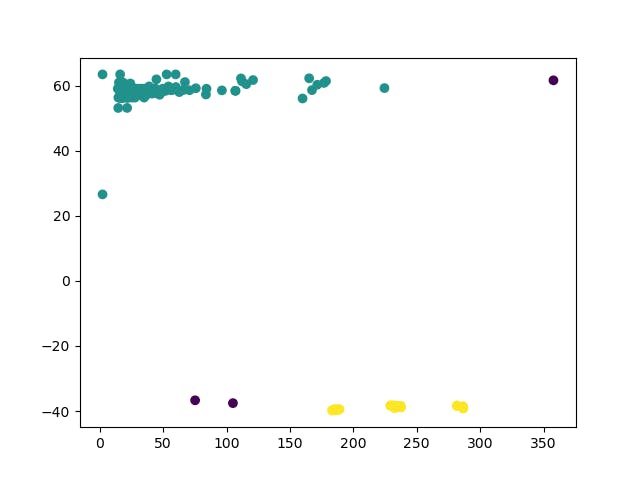
You might also note that DBSCAN requires some parameters regarding the definition of similarity between points. this is another point of possible failure on a larger test dataset, but for now it's ok. I choose to accept images where the barcode is large enough not to trip it.
So now we have the bars, we just need to read them right.
Interpreting the bars
On a barcode, each bar (black or white) has a width that is 1-4 times some basic width. The code starts and ends with widths 1-1-1 (black-white-black), has a 1-1-1-1-1 sequence in the middle, and then has two groups of six digits, each represented by a sequence of 4 numbers whose sum is 7. For example, the digit 0 on the left group is represented by 3 white - 2 black - 1 white - 1 black. The code is reversed on the right side, and there is a third series of codes in certain cases. But before we go into that, we first need to get the bar widths.
We have the width of the black bars already, from the boxes we fit to them. We need to complete the width of white bars. One way is to find the distance between two adjacent black bar centres (which we also have from the fit), and subtract from it half the bars' widths. But that's inaccurate. You might have noticed that in some (but not all) cases, the limit sequences have longer bars than the digit bars. We didn't filter them out, so they're there to disrupt. we also want to keep them as a self check. If we didn't get the limit sequences from the image, we are doing something wrong.
To overcome that, I find one line representing the direction of the barcode, and project on it the center points before the distance calculation. Although this isn't hard to do manually, sklearn helps here too. So in summary, getting the bar widths sequence looks like this:
from sklearn.linear_model import LinearRegression

def barcode_run_lengths(boxes):
    """
    Converts a barcode from a series of black boxes to run lengths of
    the black and white parts, alternating.
    Assumes all boxes are in the same angle bin, so there are no 180-deg.
    differences.
    """
    boxes.sort(key=lambda b: b[0][0]) # For now assume they're kind-of vertical.

    # Find the common line they're on. We can't naively use box centers
    # because the limit bars can be longer than the digit bars.
    lin_reg = LinearRegression()
    centers = np.array([b[0] for b in boxes])
    lin_reg.fit(centers[:,0,None], centers[:,1,None])

    line_ang = np.arctan(lin_reg.coef_[0][0])
    line_direct = np.r_[np.cos(line_ang), np.sin(line_ang)]

    run_lengths = []
    for spaceIx in range(len(boxes) - 1):
        interbox_vec = centers[spaceIx + 1] - centers[spaceIx]
        interbox_vec = line_direct*np.dot(interbox_vec, line_direct)
        space_len = np.linalg.norm(interbox_vec) - (boxes[spaceIx + 1][1][0] + boxes[spaceIx][1][0])/2.

        run_lengths.extend([boxes[spaceIx][1][0], space_len])

    run_lengths.append(boxes[-1][1][0])
    return run_lengths
Now we get, for our example image, this sequence: 1 1 1 1 3 1 2 3 1 2 1 1 1 2 3 1 1 1 4 2 1 1 3 2 2 2 1 1 1 1 1 1 2 2 2 1 1 4 1 1 1 1 1 4 2 2 2 1 1 2 3 1 1 2 1 3 1 1 1. Sum up the numbers and you'll get 95 - exactly the number of base-width modules you need to find in a barcode (3x2 + 5 for delimiters + 12x7 for digits).
It remains to check the format (that delimiters are correct) and to unpack the digits according to a documented key. this isn't interesting from a computer-vision POV, so I'll just point you to the source for the full details.
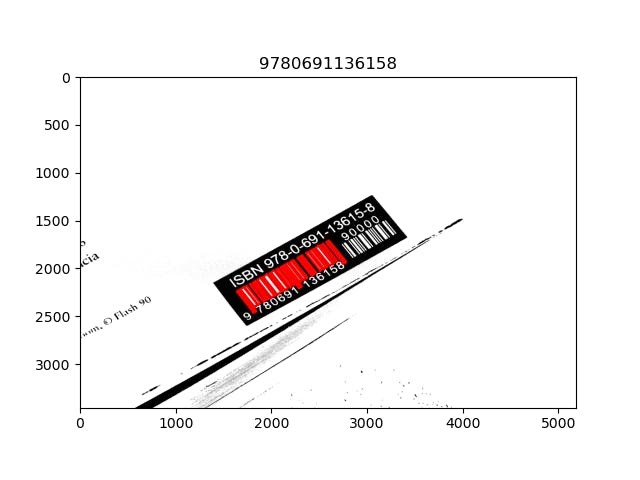
In the end, setting the figure title to the extracted numbers, I get this:
And that's it!
Well, maybe not entirely it. We've noted some weak points already. And in with classical image processing and computer vision methods like the ones I used here, you tend to find more problems the more data you test against.
Yet, this is functional, and it only took about a weekend, most of it dedicated to learning how a barcode is represented. It was fun, and it'll eventually get my digital library running, if I find the time.
Again, you're welcome to check out the full source, play with it and maybe offer your own tweaks.
